Profile of the Running ES Score & Positions of GeneSet Members on the Rank Ordered List
| Dataset | Set_03_absentNotch_versus_wtNotch.phenotype_absentNotch_versus_wtNotch.cls #wtNotch_versus_absentNotch |
| Phenotype | phenotype_absentNotch_versus_wtNotch.cls#wtNotch_versus_absentNotch |
| Upregulated in class | absentNotch |
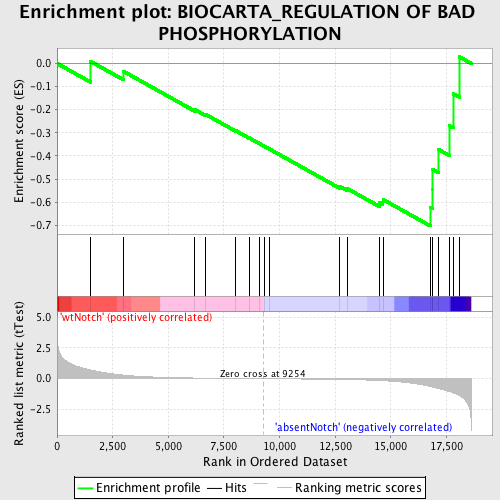
| GeneSet | BIOCARTA_REGULATION OF BAD PHOSPHORYLATION |
| Enrichment Score (ES) | -0.70323086 |
| Normalized Enrichment Score (NES) | -1.5194739 |
| Nominal p-value | 0.013752456 |
| FDR q-value | 0.64574474 |
| FWER p-Value | 1.0 |
| PROBE | DESCRIPTION (from dataset) | GENE SYMBOL | GENE_TITLE | RANK IN GENE LIST | RANK METRIC SCORE | RUNNING ES | CORE ENRICHMENT | |
|---|---|---|---|---|---|---|---|---|
| 1 | BAD | 2120148 | 1513 | 0.707 | 0.0083 | No | ||
| 2 | IL3RA | 6350468 | 2991 | 0.289 | -0.0345 | No | ||
| 3 | PIK3CA | 6220129 | 6193 | 0.053 | -0.1999 | No | ||
| 4 | BCL2L1 | 1580452 4200152 5420484 | 6668 | 0.042 | -0.2201 | No | ||
| 5 | KITLG | 2120047 6220300 | 8023 | 0.018 | -0.2907 | No | ||
| 6 | PIK3R1 | 4730671 | 8630 | 0.008 | -0.3222 | No | ||
| 7 | AKT1 | 5290746 | 9115 | 0.002 | -0.3480 | No | ||
| 8 | PRKAR2B | 3130593 5220577 | 9324 | -0.001 | -0.3590 | No | ||
| 9 | IL3 | 2480280 | 9533 | -0.004 | -0.3697 | No | ||
| 10 | PRKAR2A | 2340136 | 12700 | -0.061 | -0.5323 | No | ||
| 11 | PRKAR1B | 6130411 | 13066 | -0.072 | -0.5428 | No | ||
| 12 | BCL2 | 730132 1570736 2470138 3800044 4810037 5690068 5860504 6650164 | 14485 | -0.146 | -0.6005 | No | ||
| 13 | YWHAH | 1660133 2810053 | 14648 | -0.161 | -0.5888 | No | ||
| 14 | BAX | 3830008 | 16778 | -0.628 | -0.6236 | Yes | ||
| 15 | IGF1 | 1990193 3130377 3290280 | 16886 | -0.674 | -0.5439 | Yes | ||
| 16 | KIT | 7040095 | 16889 | -0.675 | -0.4584 | Yes | ||
| 17 | IGF1R | 3360494 | 17142 | -0.786 | -0.3723 | Yes | ||
| 18 | PRKACB | 4210170 | 17621 | -1.021 | -0.2685 | Yes | ||
| 19 | PDPK1 | 6650168 | 17818 | -1.163 | -0.1316 | Yes | ||
| 20 | PRKAR1A | 3450369 | 18084 | -1.376 | 0.0286 | Yes |

